
基于纳米粒子等离子体共振耦合的细胞中分子组装的动态影像
Dynamic Imaging of Molecular Assemblies in Live Cells Based on Nanoparticle Plasmon Resonance Coupling
基于纳米粒子等离子体共振耦合的细胞中分子组装的动态影像
Jesse Aaron, Kort Travis,‡ Nathan Harrison, and Konstantin Sokolov
Department of Biomedical Engineering, Department of Physics, UniVersity of Texas at Austin, Austin, Texas 78712, and Department of Imaging Physics, UT MD Anderson Cancer Center, Houston, Texas 77030
Received June 8, 2009; Revised Manuscript Received July 21, 2009
ABSTRACT 摘要
We used molecular-specific gold nanoparticles to monitor epidermal growth factor receptors (EGFR) in live A431 cells over time. Dark-field hyperspectral imaging, electron microscopy, and electrodynamic modeling were used to correlate optical properties of EGFR-bound plasmonic nanoparticles with receptor regulation state. We showed that receptor trafficking resulted in a progressive red shift of greater than 100 nm in the nanoparticle plasmon resonance wavelength over a time period of 60 min. Furthermore, we demonstrated that changes in peak scattering wavelengths of gold nanoparticles from 546±15 to 574± 20, and to 597±44 nm are associated with EGFR trafficking from the cell membrane, to early endosomes, and to late endosomes/multivesicular bodies, respectively. Finally, we used the changes in scattering spectra of EGFR -bound nanoparticles and a straightforward statistical analysis of RGB-channel color images of labeled cells to create near real-time maps of EGFR regulatory states in living cells.
在A431活细胞中我们用含有特定的金纳米粒子的分子去监控表皮生长因子受体(EGFR)。用暗场高光谱成像、电子显微、电动模拟等手段将已绑定了等离振子纳米颗粒的EGFR的光学属性与受体的调控状态联系起来。在纳米粒子等离振子共振超过60分钟的条件下,我们显示了受体的运输导致了大于100纳米的红移。再者,我们证实,金纳米粒子巅峰散射波长的变化(从546±15到574±20,到597±44 nm)与EGFR的运输有关(分别从细胞膜到早期胞内体,到晚期胞内体/多泡体)。最后, 利用绑定纳米粒子的EGFR的散射光谱的变化以及标定细胞的三基色图像的一个直观数据分析,我们制作了活细胞中接近实时的EGFR调控状态的图像。
Detecting and monitoring the vast number of biomolecular interactions in the cell is a central effort in biology, as these interactions largely govern the behavior of nearly all cell types. Imaging methods are an indispensable approach for measuring the spatiotemporal characteristics of protein assemblies in intact cells. In this work, we expand the application of nanoparticle plasmon resonance coupling (NPRC) and demonstrate a novel, generalized method for imaging and characterizing molecular assemblies at the nanometer length-scale in living cells.
生物学关键的任务就是探测和监测细胞中大数量的生物分子间的相互作用,因为这些相互作用在很大程度上控制着几乎所有细胞类型的行为。成像法是必不可少的测量完整细胞蛋白组装时空特性的方法。在本次工作中,我们将展开纳米粒子等离子体共振耦合(NPRC)的应用并展示一种新颖而又普遍的方法,利用这种方法我们可以在活细胞中以纳米级别的量度来描述细胞的装配,并为其成像。
Over the past decades, fluorescence resonance energy transfer (FRET) has allowed many investigators to elucidate important functional associations between pairs of proteins at submicroscopic resolution, all without destroying the cell.1 More recently, techniques such as image correlation microscopy (ICM) and its variants have been widely used to characterize larger protein assemblies and clusters, including EGFR, in situ.2,3 Although all of these techniques are eminently useful, FRET is typically limited to detecting two very closely separated (5 nm) molecules of different types.1,4 While the various ICM methods can be used to evaluate associations and clustering between many molecules on the submicrometer scale, this additional information is an ensemble average and it does not directly reveal the distribution of cluster sizes or any additional information related to nanometer-scale organization of biomolecules forming the clusters.2,3 Furthermore, ICM methods are in general highly sensitive to background interference, and the resolution of the imaging system is often not fully utilized. In addition, both FRET and ICM can be critically limited by photobleaching. These limitations are avoided in electron microscopy (EM), and in particular, the immuno-gold method to image assemblies of biomolecules at the nanometer length scale.5 However, this comes at the expense of the lack of real-time, live-cell capability and of additional tedious sample preparation. For all of these reasons, new physical methods are required that extend and/or complement currently available capabilities for quantitative monitoring of molecular clusters with high spatial and temporal resolution in living cells.
在过去的几十年里,荧光共振能量转移技术(FRET)的应用使得许多研究人员能够在亚微观无损伤的条件下阐明细胞重要功能之间的联系1。近来,图像显微技术(ICM)及其变体已经被广泛地用来描述大蛋白分子在原位的装配及群集,包括EGFR。虽然所有的这些技术都是非常有用的,但是FRET技术只适用于探测不同类型的两个非常近的(5 nm)单个分子1,4。多样的ICM技术可以在亚显微计量级别下用来测量众多分子的关系和群集,而FRET附加信息只是一种统计平均值,不直接揭示集群的分布大小或者说任何与形成群集的毫米级别的生物分子有关的附加信息。而且ICM技术对背景干扰是高度敏感的,图像系统的分辨率经常没有被充分利用。另外,FRET和ICM技术都被光漂白严重限制。在电子显微镜中这些限制因素都可以避免,特别是在纳米级别免疫金法为生物分子装配成像的条件下5。然而达到这种要求要付出一些代价,缺少了实时、活细胞性能,并需要繁冗的样品制备过程。鉴于上述所有原因,在活细胞中用高位立体瞬时分析方法去定量监视细胞群集时,就要求有新的物理解决方法来发展并补充现有可以利用的技术。
Recently, plasmonic-resonant nanoparticles have been explored as molecular-specific probes for highly sensitive detection6-16 and for photothermal damage of cells.17-20 When two or more plasmonic nanoparticles are in close proximity they exhibit the effect of nanoparticle plasmon resonance coupling (NPRC) that manifests as a spectral shift in the optical cross sections of the metal nanoparticle assemblies when compared to those observed from the isolated nanoparticles.21,22 This spectral shift is strongly dependent on the interparticle distance,23 and the sensitivity can be conveniently adjusted by modifying the particle size. NPRC is significant for particle center-to-center distances of less than about three times the particle radius, thus providing a useful range of detectable interaction distances out to tens of nanometers. Because of this behavior, NPRC has recently been demonstrated as an attractive analog to FRET, as evidenced by its use in the detection of DNA-DNA,24-26 DNA-protein,27 and protein-protein binary interactions.28 These investigations showed that NPRC is not limited by photobleaching and that it can extend the range of detectable distances by more than an order of magnitude in comparison to FRET.
最近,等离子共振的纳米粒子已经被开发成特定的分子探针,用在高灵敏度探测6-16和细胞的光热破坏上17-20。相比观察单个纳米粒子,当两个等离振子纳米粒子间距非常近时,它们就会显示纳米粒子等离振子共振耦合效应(NPRC),表现为在金属纳米粒子装配光学横截面上的一个光谱的漂移21,22。光谱漂移很大程度上取决于粒子间的距离,灵敏度可以通过改变粒子的大小来方便地调整。对中心间距小于3倍粒子半径的粒子群,NPRC是非常重要的,为上万计的纳米提供一个有效的可探测交互距离的范围。正是因为这个效应,用NPRC来演示一个有吸引力的FRET模拟,作为探测DNA-DNA,24-26 DNA-蛋白质,27 和 蛋白质-蛋白质的二态交互作用28的有效证明。这些研究显示NPRC不受光漂白的影响,而且相比FRET其扩展探测范围不在同一数量级上。
We have shown previously that NPRC provides a powerful cancer diagnostic method by facilitating the detection of growth factor receptor clustering in cancerous tissue.6,29 In the present work, we expand the applicability of NPRC to the study of molecular clustering and regulation mechanisms in living cells. We have developed a novel computational
framework to gain nanometer-scale information from NPRC spectra and, in addition, a practical image-analysis method to infer growth factor receptor regulation state.
我们之前已经证明NPRC提供了一种强有力的癌症诊断方法,通过更便利的检测聚集在癌变组织中的生长因子6,29。现在,我们扩大了NPRC的适用范围,研究活细胞内分子的聚集和调节机制。我们已经开发了一种新型的计算框架来从NPRC光谱中获得信息,除此之外,用一个实用的图像分析方法来推断生长因子受体调节状态。
We monitor the trafficking mechanisms of the epidermal growth factor receptor (EGFR), a receptor tyrosine kinase (RTK) that controls some of the most fundamental cellular processes including DNA replication and cell division.30 EGFR is also an important cancer biomarker with regulatory pathways that have profound implications for the development of new cancer therapeutics.31,32 The EGFR internalization process is a key regulatory pathway that determines cell behavior. It is well known that membrane-bound EGFR elicits growth-promoting signals upon ligand binding. However, it has recently been shown that signaling can continue even after internalization of EGFR in early endosomes and that the signaling activity finally ceases after entry into lysosomes.31 Further, processes involving EGFR recycling and nuclear translocation add to the complexity of EGFR’s role.30,33 Thus, it is vital that an effective EGFR imaging strategy not only involves detection of the protein, but also includes the nanometer-scale details of its organization, aggregation, and sequestration within cellular compartments. In this study, we demonstrate that NPRC is a convenient method that facilitates the retrieval of this information using dark-field color imaging of live cells labeled with EGFR specific gold nanoparticles.
我们观察了表皮生长因子受体(EGFR)的交易机制,一个酪氨酸激酶(RTK)受体控制了一些最基本的细胞过程,包括DNA复制和细胞分裂30。在治疗手段中EGFR也是重要的肿瘤标志物,对开发新型癌症治疗法有深远的影响31,32。EGFR内在过程是一个关键的调节方式,决定了细胞的行为。众所周知,绑定EGFR的膜能引起配位基绑定促进信号的增长。然而,最近发现,即使在早期的胞内体EGFR内化之后信号可以继续发放,最终在溶酶体进入后才停止31。 涉及EGFR的再循环和细胞核的转移过程都增加了EGFR的复杂性30,33。因此问题的关键就明显了,有效的EGFR不仅涉及蛋白质的检测,也包括细胞局部区域内的组织、聚合与分离的纳米级别细节。在本研究中,我们证实NPRC是一个方便的方法,有利于检索暗场条件下贴有EGFR特定金纳米粒活细胞的颜色图像信息。
Synthesis of Molecular Specific Gold Nanoparticles 特定金纳米粒子分子的合成
Near-spherical gold nanoparticles (with average diameter of 25 nm) were synthesized using the method described by Frens, whereby chloroauric acid (HAuCl4) is chemically reduced using sodium citrate.34 By altering the Au3+ to citrate ratio, the size of the resulting nanoparticles can be controlled. For the size of particles used in the present work, this protocol produces gold colloid with a particle concentration of approximately 6 × 10¹¹ particles per milliliter.
近球形的金纳米粒子(平均直径25nm)使用了Frens描述的方法来合成,用柠檬酸钠的化学方法减少氯金酸34。通过改变Au3 +与柠檬酸盐的比率、可以控制产生纳米粒子的大小。此次工作中的粒子的大小,拟定金胶质的粒子聚集浓度大约为每毫升6×10¹¹颗粒。
To conjugate monoclonal antibodies to the surfaces of the gold nanoparticles, a heterobifunctional linker was utilized, as described in ref 35. Briefly, anti-EGFR monoclonal antibodies (clone 29.1.1 Sigma) were purified from ascites fluid using a 100 kDa MWCO centrifugal filter and resuspended in 40 mM HEPES solution (pH 7.5) at a concentration of 1 mg/mL. Sodium periodate (NaIO4) was added to the antibody solution at a final concentration of 10 mM for 30 min under mild agitation and protected from the light. Sodium periodate oxidizes the hydroxyl moieties located on
the glycosylated Fc region of antibodies to aldehyde groups. Then, the solution was diluted 50-fold using 1× PBS, and 200 μM of a heterobifunctional linker was added (Sensopath Technologies, Inc.).
利用异型双功能连接器把单克隆抗体结合到黄金纳米粒子表面,参考35。简单地说, 抗EGFR的单克隆抗体(克隆29.1.1σ)要用一个100 kDa的MWCO离心式过滤器来从腹水中剔除,并在40 mM浓度为1 mg/mL的HEPES溶液(pH 7.5)中悬浮处理。添加高碘酸钠(NaIO4)到抗体溶液中,并最终在弱风潮,防止光线条件下保存30分钟。浓度在最后10毫米为30分钟,。高碘酸钠将位于抗体糖化基区域的羟基氧化成醛基。然后,用1× PBS将溶液稀释50倍,然后添加200μM的异型双功能连接器(Sensopath科技有限公司)。
The linker consists of a PEG chain containing two sulfhydril groups on one end, and a hydrazide moiety on the other. The newly formed aldehydes on theantibodies condense with the hydrazide group on the linker, leaving the thiols available for binding to the gold surface. Excess unreacted linker was removed via centrifugal filtration as described above, and the antibody-linker solution was stored at 1 mg/mL in 1× PBS for up to 4 weeks. Prior to cell labeling, the antibody-linker solution was first diluted 100-fold in 40 mM HEPES solution to which an equal volume of 25 nm gold nanoparticles was added. The two components were allowed to mix under mild agitation for 20 min, followed by addition of 5 kDa monofunctional thiolated polyethylene glycol (mPEG-SH, Nektar) to 10-6
M final concentration. Five minutes after addition of mPEG thiol, antibody-nanoparticle conjugates were spun down at 3400 × g for 30 min, the supernatant removed, and the conjugates resuspended in phenolphthalein-free DMEM cell culture media (Gibco) containing 10% FBS.
这个连接器有一个PEG链和一个酰肼组成,PEG链包含两个在一端的sulfhydril群组。这个新合成的醛在连接器上与酰肼群组被浓缩,残余的硫醇可用在绑定黄金表面上。多余的未反应的连接器如上所述通过离心过滤被移除, antibody-linker(抗体连接器)溶液储存在1mg/ mL, 1×PBS中4周时间。在这之前,要标记细胞, 抗体连接器溶液首先在40毫米的HEPES中稀释100倍, 相当于添加等体积25 nm金纳米粒子。这两个部件混在一起柔和搅拌20分钟,紧随其后的是增加5 kDa单功能硫醇盐的聚乙二醇(mPEG-SH, Nektar),达到10-6 M的最终浓度。在添加mPEG硫醇五分钟后,抗体纳米粒子连接器在3400 × g的条件下减速旋转30分钟,然后除去上层清夜。将连接器在含有10% FBS的无酚酞细胞培养基中再次悬浮处理。
Gold particles of 25 nm diameter were used because they provide high contrast in detection of EGFR overexpressing A431 cells.29 The particles were conjugated with antibodies that do not block receptor activation by EGF.36 We have demonstrated in previous studies that nanoparticles conjugated with either monofunctional thiolated polyethylene glycol (mPEG-SH) or a nonspecific antibody do not interact with EGFR expressing cells. Further, specificity of EGFR binding by the gold conjugates was shown by displacement and competition assays in the presence of free anti-EGFR antibodies.29
使用直径25 nm金粒子是因为在探测EGFR表译A431 细胞29时可以提供很高的对比度。结合了抗体的粒子,不会通过EGF36来阻止受体反应。我们在先前的研究已经证明, 不管是单功能硫醇盐的聚乙二醇(mPEG-SH)还是非特异性抗体与纳米离子结合都不会影响EGFR表译细胞。与单功能硫醇盐的共轭粒子聚乙二醇(mPEG-SH)或非特异性抗体不与表皮生长因子受体表达细胞。而且在无抵抗EGFR抗体条件下检测出的取代和竞争现象显示了绑定金连接物的EGFR的特性29。
Dynamic Imaging of Live Cells. A431 keratinocytes were cultured on 22 mm square glass coverslips using DMEM/ F-12 (50/50) growth medium, supplemented with 5% FBS (Gibco) in a 37 C and 5% CO2 environment. For live imaging experiments, A431 cells were seeded onto optical imaging flow chambers (ibidi μslide chambers, Integrated BioDiagnostics) and allowed to adhere overnight. Then, the chambers were separated into two samples: chambers where cells were exposed to 10 μM AG1478 (Calbiochem), a EGFR phosphorylation inhibitor,37 and control chambers where cells were not exposed to the inhibitor. The samples were then kept for another 24 h under serum-starvation conditions. Chambers were placed under the microscope and connected to a peristaltic pump supplying either DMEM (containing 10% FBS) media or gold nanoparticle conjugates in complete DMEM at low flow rates (typically 1 mL/min). Temperature control of solutions was accomplished through the use of an in-line resistive heater (Harvard Apparatus) to 37 C before being introduced into the chamber.
活细胞的动态影像。A431角质化细胞培养在22毫米平方的盖盒内,F-12(50 / 50)细胞培养基增长介质在37 C 、 5% CO2条件下辅以5%的FBS来培养。对于活影像实验,将A431细胞植入到光学成像流动腔中(ibidi μslide chambers, Integrated BioDiagnostics),让其附着过夜。然后将腔分入两个样品中-腔和控制腔。腔中细胞暴露在10 μM AG1478 (Calbiochem 一种新的磷酸化抑制剂)下,控制腔内的细胞不暴露在抑制剂下。然后再将样品在血清饥饿条件下保存24小时。把腔放在显微镜下,连接到蠕动泵上以低流速(通常 1 mL/min)供给DMEM (含10% FBS)介质或者供给纯DMEM金纳米连接物。用内置电阻加热器来控制温度,在引进腔之前,先将温度提升到37度。
Samples were continuously exposed to conjugates at approximately 1012 particles/mL under low flow conditions for 45-60 min during time-lapse imaging. Cell samples were imaged using a Leica DM6000 upright microscope, a 100 W halogen light source, and an oil-immersion darkfield condenser (Leica) with an N.A. of 1.2. A long-working distance (1.2 mm), 63× objective (Leica) with 0.75 NA was used for collection of scattering signal and the images were recorded by a high-sensitivity 12-bit color-mosaic CCD camera (SPOT Pursuit XS, Diagnostic Instruments). To ensure cell viability over the duration of live imaging experiment, we carried out Calcein AM assay (Molecular Probes) after 2 h of cell exposure to anti-EGFR nanoparticle conjugates. Results (figure available in Supporting Information) showed that there are no statistically significant changes in cell viability between cells treated with gold nanoparticles and unlabeled controls.
在延时影像过程中,样品以大约1012粒子/ mL的低流量在连接器中持续暴露45-60分钟。用莱卡DM6000直立显微镜像,辅以100瓦卤素光源和数值孔径为1.2的油浸暗场镜头(Leica) 采集图。用一个长工作距离(1.2 mm)、 0.75 NA、63倍的物镜(Leica)来采集散射的信号,用高敏感度的12字节的色拼CCD照相机(SPOT Pursuit XS, Diagnostic Instruments)来记录图像。为确保整个活动影像实验的细胞活力,在细胞暴露在抗EGFR纳米颗粒连接物中2小时后,我们执行钙黄绿素AM实验(分子探针)。结果显示金纳米粒子标定的细胞与未标定的细胞的稳健性在统计上没有显著的改变。

Figure 1. Dynamic imaging of live cells. (A) A schematic of EGFR trafficking upon ligand binding. This process was monitored in real time in live cells labeled with anti-EGFR gold nanoparticles under the microscope. (B) Live A431 cells and (C) live cells pretreated with 10 μM AG1478, which reduces endocytosis. From left to right, images show color and intensity changes in the gold nanoparticle optical signal at 0, 15, 30, and 50 min after initial exposure to nanoparticles. Dark-field images of untreated cells (B) display changes in color from blue to yellow-orange that are not present in treated cells (C). The arrow in panel B, far right, indicates the presence of a filopodium emanating from an adjacent cell. Images were acquired using transmitted dark-field illumination and a longworking distance 63×, 0.75 NA objective.
图一活细胞动态影像。(A)依据配合基绑定的EGFR交易图。在标定抗EGFR金纳米粒子活细胞中这个进程是在显微镜下实时监控的。(B)活A431细胞和(C)用 10 μM AG1478(降低内吞作用)预处理的活细胞。从左到右分别为从初始暴露到纳米粒子到0, 15, 30和50 分钟后图像显示金纳米粒子光学信号的颜色和强度的变化。未经处理的暗场图像的色彩从蓝到黄橘色的变化,这是经过处理的细胞显示不出来的。图B中最右边的箭头显示邻近细胞放射出来的丝线。图像的获取要求使用透射暗场照明、长工作距离、63倍、0.75 NA的物镜。
Dynamic imaging of live cells labeled with anti-EGFR nanoparticles exhibited a progressive color change from green to yellow, and finally, to orange-red (Figure 1B). The color changes are well-correlated in time with known trafficking dynamics of EGFR (Figure 1A).33,38 Initially, EGFR molecules dimerize and aggregate in the plasma membrane, followed by endocytosis into early endosomes. These early endosomes can then either recycle to the cell surface or proceed through formation of late endosomes and MVBs within 20-60 min.33,38 The effect of continuous color changes was disrupted by a potent EGFR inhibitor, AG1478, which interferes with EGFR trans-phosphorylation and internalization (Figure 1C).37 These data indicate that the observed color changes are associated with EGFR reorganization within the cell both as a result of ligand binding, and also due to intracellular trafficking in vesicles. In images taken from untreated samples, the relative intensity of the red channel increases from 27 to nearly 34% (Figure 1B) whereas for samples treated with AG1478 inhibitor, thisvalue increases only from 28 to 30% (Figure 1C).
标定抗EGFR纳米粒子的动态活细胞影像显示了连续的颜色变化,从绿到黄,最终到橘红(图 1B)。这些颜色的改变同步关联着已知的EGFR交易动力。起初EGFR的二聚和聚合是在质膜中,随后内吞成为早期的胞内体中。这些早期的胞内体可以再循环到细胞表面或者在20-60分钟内继续行进形成后期胞内体或MVB。AG1478(一种强有力的EGFR抑制剂)将打断连续颜色变化这种效果,因为它干扰EGFR的横穿磷化作用和内化作用(图 1C)37。这些数据表明已测的颜色变化与EFGR在细胞内的重组有关系,是配合基绑定造成的,也是由于细胞内的囊泡交易。在未经处理样品的图像里, 红色的相对强度从27%提到了34%(图 1B),相反,对用AG1478抑制剂处理的样品这个数值的增长就只是28 % 到30%了(图 1C)。
Cell Labeling at Different Temperatures. In order to establish a relationship between the scattering behavior of EGFR-bound plasmonic nanoparticles and the dynamics of EGFR regulation in live cells, we carried out labeling at 4, 25, and 37 C. Temperature control allows the activationand trafficking mechanisms of EGFR to be arrested at critical points. EGFR internalization is inhibited in cells at 4 C; internalization proceeds to formation of early endosomes at 25 C; and finally, complete EGFR regulation proceeds through the formation of multivesicular bodies (MVB) and late endosomes within an hour at 37 C.33,38,39 For the temperature-based experiments, cells were seeded onto coverslips at between 50 000-100 000 cells/mL and left to adhere overnight. Then, cells were washed in 1× PBS, and 1 mL of gold nanoparticle bioconjugates in DMEM supplemented with 5% FBS was added. Coverslip-adherent cell samples containing nanoparticles were placed in 4, 25, and 37 C environments and allowed to interact for 60 min. Nanoparticles were then aspirated from the sample, followed by washing in 1× PBS, and fixation with freshly prepared 4% formaldehyde at 4 C for 15 min. Color images of cells labeled at the three temperature points showed a readily observable changes from green (4 C, Figure 2a) to yellow (25 C, Figure 2b) and finally to orange-red (37 C, Figure 2c) color in the scattering signal.
在不同的温度下标定细胞。为了在等振纳米粒子的散射反应和活细胞中EGFR机制的动力之间建立关系,我分别在4、25和37 C下进行标定。温度控制可以让EGFR的激活和交易机制在关键的点停止。在C时细胞的EGFR内化被抑制。在25 C细胞的内化进行形成早期的胞内体,最终在37 C条件下1小时内通过形成多泡体和后期胞内体获得完整的EGFR调控机制33,38,39。对基于温度的实验,细胞要以50 000-100 000个/mL植入盖玻片,并让其附着过夜。然后用1× PBS和添加了5% FBS金纳米粒子生物连接物的补充培养基冲洗细胞,然后将包含纳米粒子细胞样品的盖玻片被放入4, 25, 和 37 C条件下,让其作用60分钟。随后纳米粒子从样品中被吸走,接着在1× PBS中冲洗细胞,并用已备的新鲜的4%甲醛在4 C条件下固定15分钟。在三种不同温度下标定的细胞的色彩图像显示了散射信号的明显变化,从绿(4 C, 图 2a)到黄(25 C, 图 2b)最终到橘红(37 C, 图 2c)。

Figure 2. Cells labeled at different temperatures. Dark-field images of A431 cells labeled with 25 nm anti-EGFR gold nanoparticle conjugates at 4 (a), 25 (b), and 37 C (c). Dark-field microscopy reveals light scattering from the samples. Controlling temperature arrests the normal EGFR regulatory processes at critical points with receptors remaining on the cell membrane at 4 C and endosomal internalization and multivesicular body sorting at 25 and 37 C, respectively. TEM of identical samples (d, 4 C; e, 25 C; and f,
37 C) shows the nanometer-scale EGFR rearrangements that correspond to the optical images. In (g), a schematic illustrates the qualitative relationship between EGFR regulation state and optical signature of the associated gold nanoparticles.
图2 在不同温度标定细胞。图中显示标定了25 nm抗EGFR的金纳米粒子连接物的A431细胞在4 (a)、 25 (b)和37 C (c)条件下的暗场图像。暗场显微镜揭示样品的光散射。通过控制温度来阻止正常EGFR调控程序。在4 C时受体停留在细胞膜表面,在25和37 C时分别进行胞内体内化、多泡体分类拣选。(d, 4 C; e, 25 C; 和 f, 37 C) 完全相同样品的TEM显示了纳米级别EGFR的新排列,这种TEM图像与光学图像是对应的。图(g),显示EGFR的调控阶段与有关金纳米粒子光学信号之间的定性关系。
The corresponding transmission electron microscopy (TEM) images of labeled cells (Figure 2d-f) showed the temperature-dependent changes in the nanometer-scale organization of EGFR that had been reported by others.39 At 4 C, nanoparticles are located on the cell membrane in small clusters. Increasing the temperature to 25 C results in a more three-dimensional, volumefilling aggregate morphology that is consistent with endosomal uptake. At 37 C, progression of EGFR trafficking leads to appearance of an even more complicated aggregate structure corresponding to MVBs, which are destined for EGFR degradation.
标定细胞的透射电子显微图像(图 2d-f)显示了纳米级别EGFR的调控与温度有关的变化,这曾经被报道过39。在4 C时,纳米粒子被安放在小群集的细胞膜上。温度提高到25 C时会导致形成更三维、更饱满的结合形态,这与胞内体的摄取有关 。在37 C时,EGFR的交易进程导致出现了一个非常复杂的与MVB相一致的聚合结构。
We used hyperspectral imaging to quantify the nanoparticle scattering changes in relation to EGFR behavior (Figure 3, a-i). Hyperspectral images were acquired using the PARISS system (Lightform, Inc.). Scattering peaks in the range of 530-550 nm are present in images obtained at 4 C (Figure 3d); at this temperature EGFR is predominantly located on the cytoplasmic membrane. Increased red-shifting of the peaks becomes apparent at 25 C with EGFR located predominantly in early endosomes (Figure 3e), while a wide range of scattering peak positions is evident at 37 C (Figure 3f). At 4 and 25 C (Figure 3g and h, respectively), labeled cells display peak wavelength distributions with mean and standard deviation values of 546 ±15 and 574 ± 20 nm, respectively. Interestingly, at 37 C (Figure 3i), there is a large degree of heterogeneity in peak scattering wavelengths (mean and standard deviation, 597 ± 44 nm); this is consistent with the simultaneous presence of multiple regulation/ trafficking stages of EGFR within the cell.
我们用高光谱成像来量化与EGFR行为有关的纳米粒子散射变化(图 3, a-i)。高光谱成像要求使用PARISS系统 (Lightform公司)。散射的巅峰在530-550 nm之内的图像采集于4 C 条件下(图 3d):在这种条件下,EGFR明显位于细胞质的膜上。在25 C时随着EGFR主要集中在早期胞内体时红色漂移开始增多(图 3e)。然而在37 C时宽谱波段的巅峰位置很明显(图 3f)。在4 和 25 C(图 3g 和 h),波峰分布的平均值和标准差分别为546 ±15 和 574 ± 20 nm。有趣的是,在37 C (图 3i)散射光谱的波峰有很大程度的偏移(平均值和标准差为597 ±44 nm);这与细胞内存在EGFR多样机制和交易阶段是一致的。

Figure 3. Quantitative relationship between scattering from EGFR-bound gold nanoparticles and EGFR regulatory stages. Hyperspectral darkfield microscopy of cells labeled at 4 C (left column, a,d,g), 25 C (middle column, b,e,h), and 37 C (right column, c,f,i). The data was acquired using the microscope settings described in Figure 1. Representative single-pixel spectra from a cell image display scattering peaks at ca. 546 (a), 576 (b), and 601 nm (c). Cell images in (d-f) are color-coded according to the scattering peak position at each pixel in the field of view. Pixels that did not have an identifiable peak in a corresponding spectrum were not assigned a color. Distributions of the peak scattering wavelengths indicated in (d-f) are shown in (g-i). Electrodynamic simulations of scattering from nanoparticle aggregates are shown in (j-l) for the following three typical structures: a 4-particle chainlike structure (j,m), a 19-particle disklike structure (k,n), and a 130-particle volume-like structure (l,o). The total scattering cross section is plotted for each structure, alongside a rendering of the corresponding detailed particle arrangement (m-o). Distinct red shifting and broadening of the scattering spectra is due to both the affect of the increased number of contributing particles and the effect of the transition from a 2D to a more 3 D volume-filling morphology.
图3. 绑定金纳米粒子EGFR的散射与EGFR调控阶段之间的定量关系。在4 C (左边, a,d,g), 25 C (中间, b,e,h), 和 37 C (右边, c,f,i)标定细胞的暗场高光谱显微。用图1中描述的显微装置来获取数据。在细胞图像中代表性的单像素光谱显示了在大约 546 (a), 576 (b)和 601 nm (c)散射的波峰。(d-f)图像是根据视场范围内每一个像素的散射波峰位置标定的颜色。如果一个像素没有可以辨认的波峰与光谱相对应的像素,就不给分配颜色。(g-i) 显示了(d-f)中顶峰散射波长的分布。(j-l)为下面三个典型结构是纳米粒子聚合物光谱的电动模拟:一个4-粒子的链状结构(j,m)、一个19-粒子的盘状结构(k,n),一个130-粒子的卷装结构(l,o)。全部的散射截面都标给每一种结构标绘的,旁边附带相应的粒子分布细节(m-o)。受有效粒子数目增长的影响和从二维到三维的形态变化的作用产生了明显的红色漂移和散射光谱的增宽。
Electrodynamic Modeling of Light Scattering from Metal Nanoparticle Aggregates. 金属纳米粒子聚合物光散射电动模型。
In order to further explore the relationship between nanoparticle aggregate morphology and the associated optical cross sections, we implemented detailed electrodynamic simulations. The computational electrodynamics codes used for the nanoparticle aggregate simulations are part of a new T-matrix code-base implemented entirely in C++, which has been developed over the past several years.40 A hybrid multithreaded messagepassing- interface (MPI) task model is used throughout, allowing optimal utilization of modern cluster-computing resources. The specific T-matrix formulation used, as extended to aggregates, is based primarily on the methods discussed in Mackowski, Mishchenko,41-43 and Stout.44 The specifics of the permittivity functions used are described in Aaron et al.45 In all cases, incident illumination is unpolarized with wave-vector directed into the page as the rendered structures are shown (Figure 3m-o). Gold spheres are 25 nm in diameter, surrounded by water, with mean interparticle center-to-center spacing of 2.4 times the particle radius. The particles are normally distributed in 3D about ideal lattice-points with a fractional standard deviation of 0.07.
For each of the aggregate morphologies, simulation structures were constructed using typical values for aggregate particle number, interparticle spacing, and overall morphology as indicated from the TEM images.
为了进一步发掘纳米粒子聚合物形态与联合光学截面之间的关系,我实施详细的电动模拟。用于计算纳米聚合模拟的电动代码是完全应用基于C++的部分新型T矩阵代码,它是在过去的几年中被开发出来的。自始至终都使用混合的多线程的信息通道截面(MPI)工作模型,采用最佳的现代群组计算资源。具体的扩展至聚合物的T-矩阵构架主要基于Mackowski, Mishchenko41-43 和 Stout44探讨的方法。介电常数函数的细节在Aaron et al上有陈述。在所有的实验中入射光都是非偏振的,波动矢量像图 3m-o一样指向页面。金球体直径为25nm,由水环绕,粒子中心间隔为2.4倍粒子半径。粒子的3D理想晶格点分布的小数标准偏差为0.07。每一个聚合形态都用TEM图像中描述的聚合颗粒的数目、颗粒空间、以及整个形态的典型值来构造。
The optical behavior of nanoparticle aggregates has a complicated, nonlinear dependence on details of the aggregate morphology, in addition to a greatly enhanced optical cross section that varies, in general, quadratically as the number of particles in the aggregate.29,40 The details of aggregate morphology may include receptor/nanoparticle number, spacing, and overall arrangement in space (such as 2D planar or a more 3D volume-filling configuration). In general, the effect of interparticle coupling produces a red shift and broadening of the resonance peak. Figure 3(j-l) shows scattering cross sections from three typical structures (Figure 3m-o) that were designed to approximate the aggregate morphology indicated in Figure 2d-f. Note that the simulated spectra show the overall redshifting and peak broadening, consistent with spectra shown in Figure 3a-c.
纳米粒子聚合物的光学反应复杂非线性地依赖聚合物的形态细节,而且很大提高光学截面群集粒子数量的变化29,40。聚合物的形态细节可以显示受体/纳米粒子的数量、空间和总体的空间分布(比如二维平面或者三维立体结构)。通常情况粒子间耦合的影响会产生一个红色漂移和谐振波峰的变宽。图3(j-l)显示三种典型结构(图 3m-o)的散射横截面,这三种模型被设计成近似聚合物形态,图2d-f。注意的是模拟光谱显示总体红移和波峰增宽,与图3a-c描述的一致。
For random aggregates, due to the high-order, nonlinear dependence of the plasmonic resonance coupling on the interparticle spacing, small statistical fluctuations in particle position about the mean have a significant effect on spectral shift.40 In addition, three-dimensional more volume-filling aggregates, such as those seen in endosomes, experience significantly more spectral shift than two-dimensional aggregates. This is noteworthy because it indicates that NPRC can detect differences in morphology associated with internalization events due to corresponding changes in the nanometer-scale organization of EGFR.
对于随机的聚合物,由于在粒子空间内高位非线性地依赖等振粒子共振耦合,所以粒子位置平均值波对光谱漂移有明显影响。而且像那些在胞内体看到的三维volume-filling 比二维聚合物经历着更多的光谱漂移。这是值得关注的,因为它说明NPRC可以探测到形态上面的差别与内化作用有关,这种内化作用是由相应纳米级别EGFR组织的变化导致的。
Monitoring of EGFR Trafficking. Having established the relationship between the scattering properties of EGFR-bound nanoparticles and EGFR regulatory stages, we examined the degree to which RGB imaging could be effectively employed to monitor EGFR trafficking. It appeared that the increase in the relative intensity of the red channel in color images of live cells (Figure 1, B) was a pronounced indicator of EGFR activation and endocytosis. Therefore, we used this parameter to correlate color changes in live cell images with EGFR regulatory stages. To accomplish this, the hyperspectral data presented in Figure 3 were grouped into three categories, corresponding to the associated EGFR regulatory states, (1) surface receptors, (2) early endosomes, and (3) late endosomes/MVBs. Pixel-data from at least five complete cells were analyzed in each group, representing at least 1000 spectra per group. The resulting spectra were used to obtainstatistically distinct distributions for intensity-normalized red channel values characteristic for each EGFR state (Figure 4). Then, for each nonbackground pixel in the time-lapse images (shown in Figure 1), we determined the probability that its normalized red channel value falls within each ofthe distributions associated with EGFR states (Figure 4). These paired comparisons resulted in three p-values that were used as weighting factors in assigning a pseudocolor to each pixel in live cell images. This analysis resulted in images where color represents a statistical probability of a regulatory stage of EGFR (Figure 5).
监视EGFR交易。 既然已经建立了绑定纳米粒子的EGFR散射性质与EGFR的调控阶段之间的关系,我们检验三基色图像等级也可以有效地用来监视EGFR交易。活细胞颜色图像的红带相对强度出现增长(图 1, B)是EGFR激活和内吞作用的一个明显标志。因此,我用这个参数将活细胞图像颜色变化与EGFR的控制阶段联系起来。为了达到这个目标,图3提供的高光谱数据被分成三个类别,分别对应相关联的EGFR的调控阶段。(1)表皮受体,(2)早期胞内体,(3)晚期胞内体/MVB。每组至少要分析5个完整的细胞被,每组至少代表1000光谱。用得出的结果光谱被来为每一个EGFR区域标准化红带强度值获得统计上的明显的区域分布(图4)。然后对每一个无背景像素的延时图像,我们分析标准红带值属于每一个相关EGFR阶段的几率。这些成对的比较导致3个假定值,在为活细胞图像每个图像设定伪色时这些假定值被用作权定因数。这个分析可以形成图像,在图像中颜色代表着EGFR控制阶段的统计概率(图 5)。
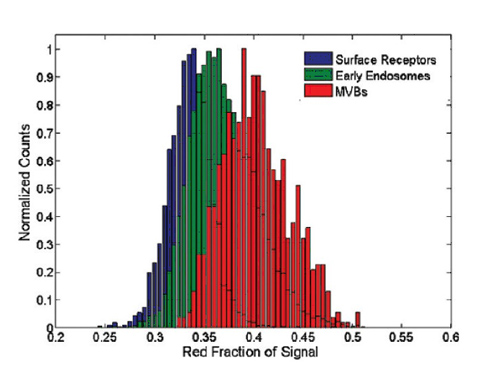
Figure 4. Relative red channel intensity distributions for gold nanoparticle labeled EGFR molecules on the cell surface (blue), in early endosomes (green), and in late endosomes (red). For the CCD used, the red channel collects signal in the 600-700 nm wavelength range. Increasing plasmon resonance coupling in each case results in an overall increase in red channel intensity. Live cell images from Figure 1 were analyzed on a pixel by pixel basis and compared with the three distributions shown via a statistical z-test.
图4.标定金纳米粒子EGFR分子的相关红带强度分布――细胞表面(蓝)、早期胞内体(绿)、后期胞内体(红)
由于CCD的使用,红带在600-700 nm波长范围内收集信号。每种情况等离子共振耦合的增加都导致红带强度整体的增加。用像素原理对图1活细胞图像进行一个像素的分析,并与一个数据z-测试显示的三种分布相比较。
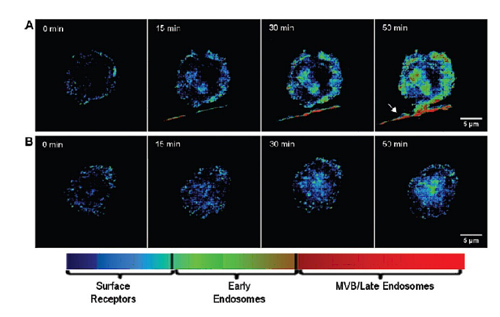
Figure 5. Pseudocolor images of live cells representing distribution of EGFR regulatory stages. Statistical analysis of color time-lapse images shown in Figure 1 results in color-coded maps of EGFR distribution in untreated cells (A), and in cells after treatment with 10 μM AG1478 (B); a blue color indicated high probability that EGFR is located on the cytoplasmic membrane, green indicates location in the early endosomes, and finally, red indicates location in the late endosome/MVBs. Note that treatment with AG1478 markedly reduces endocytosis of EGFR. The arrow in panel A, far right, indicates a filopodium emanating from an adjacent cell, which displays heavy EGFR trafficking along its axis.
图5 代表EGFR调控阶段分布的活细胞伪颜色图像
对图1显示的延时图像色彩统计分析决定了要为EGFR的分布标定颜色―未处理细胞(A)、用10 μM AG1478处理的细胞(B)。蓝色表明EGFR位于胞质膜的可能性很高,绿色表示位于早期胞内体,红色表示位于晚期胞内体/MVB。注意AG1478处理明显地降低了EGFR的内吞作用。A图最右边的箭头表明丝线来自邻近的细胞,显示了围绕其轴线的大量EGFR交易。
In contrast to previous studies that employed fluorescent tags such as quantum dots46 to monitor EGFR trafficking, the use of plasmonic resonant nanoparticles provides additional information about proximity and nanometer-scale organization of biomolecules. It has been shown that the optical changes corresponding to interparticle distance between nanoparticle pairs can be precisely quantified23 and work is under way to develop a similarly quantified model for nanoparticle aggregates.40
与以前的用荧光标记的研究(例如量子点46)相比,等振离子纳米粒子的使用提供了邻近纳米级别生物分子组织的附加信息。已经证实,与粒子间距相对应的光学变化可以被精确地量化,而且为纳米粒子连接物开发一个类似的量化模型40工作正在进行。
The application of NPRC described here can be extended to other RTKs and G-protein-coupled receptors that are involved in signal transduction.33 Other molecular systems for investigation may include integrin clustering and immunological synapse formation. This method can potentially be applied to heteromolecular interactions such as interactions between different RTKs if the interacting molecules are labeled with plasmonic nanoparticles that exhibit distinct optical properties. Theoretical simulations that are described here can be used to optimize the design of nanoparticles that would produce distinct optical changes in the case of homoand heterointeractions.
这里描述NPRC的应用可以扩展到其他的RTK和涉及信号转换的G蛋白耦合受体33。其它调控分子的系统包含整合蛋白群集免疫学突触形状的信息。如果相互作用的分子被标定显示明显光学特征的等离振子纳米粒子,这种方法可以用来探测异性分子的交互作用,例如探测不同RTK间的交互作用。这里的理论模拟可以用来优化纳米粒子的设计,这种设计在单一异性交互作用的情况下将产生明显的光学变化。
A primary strength of NPRC as a biosensing tool is associated with the complex optical behavior of plasmonic nanoparticle assemblies. The dramatic changes in optical properties associated with nanometer-scale changes in organization facilitate the development of statistical associations with the biological processes under observation. Further understanding of NPRC will be vital for its development as a quantitative biosensing tool. Issues such as particle shape heterogeneity, as well as the more nuanced effects of nanoparticle aggregate morphology on spectral characteristics (such as scattering peak width) are still under study and promise to reveal a wealth of additional information.
作为生物感应工具NPRC主要的优点是联系着等离子纳米粒子装配的复杂光学反应。观察下,组织中与纳米级别变化有关的光学特征数据的改变促进了生物进程统计联系的发展。为其作为一个定量生物感应工具的发展,进一步了解NPRC是非常重要的。粒子形状的不均匀性以及纳米粒子聚合物对光谱特征的微妙影响(例如散射波峰宽度)还在研究当中,有望能够揭示大量的有用的附加信息。
NPRC can be used as an independent method or it can potentially be integrated into already in-use biophysical methods such as FRET,1,4 ICM,2,3 or EM5 to provide additional complementary information. TEM with immuno gold labels has been used to study 3D organization of proteins with high spatial resolution in fixed samples. The method presented here allows extending this TEM imaging approach to live-cell dynamic optical imaging of molecular assemblies with unambiguous information about the proximity and nanometer- scale organization of biomolecules. While not strictly a super-resolution method, NPRC can provide sub diffraction characterization capability over distances ranging from a few tens of nanometers, which significantly exceed distances available through FRET. In addition, NPRC exhibits sensitivity to geometrical characteristics of protein clusters such as a planar 2D or a volume-filling 3D aggregation in livecell imaging and it is capable of following cluster dynamics in real time.
NPRC可以被用作独立的方法,也可以整合到先前使用过的生物物理方法上(例如FRET,1,4 ICM,2,3 或者 EM5)来提供附加的完善信息。有免疫金标签的TEM已经被用在研究固定样品高分辨率的三维蛋白质组织。这里使用的方法是将TEM图像扩展到活细胞动态光学图像,这些影像是分子组装(关于邻近和纳米级别生物分子组织)的清晰信息。然而对那些不要求超分辨率的方法,NPRC可以提供描述辅助衍射特征的能力,排列距离超过成千上万纳米,这明显超过了FRET的有效距离。此外,NPRC展现了其对蛋白质族几何特征的敏感性,例如活细胞图像中平面二维和立体三维聚合物,并且能够实时的追踪族的活力。
The sensitivity of NPRC to nanometer-scale geometry of individual clusters can potentially provide invaluable complementary information to ensemble population measurements such as cluster density and the average number of receptors per cluster that are afforded by ICM methods. Further, gold nanoparticles themselves can make excellent probes for ICM, due to their brightness and photostability, which will facilitate the direct combination of these techniques. We anticipate that NPRC will continue to gain interest among biological and biomedical researchers as a method to produce unique insight into biomolecular interactions.
NPRC对纳米级别的个别群簇的敏感性可以提供潜在的非常有价值的补充总体种群测量值信息,例如ICM方法可以提供群密度、每个种群受体的平均数量。而且,纳米粒子本身也可以成为ICM极好的探针,因为其亮度和耐光性都可以促进这些技术的直接联合。我们预期NPRC将会不断引起生物及生物医药研究者的兴趣,这种方法对生物分子内作用有独特的洞察力。


