
 |
|
|||||||||||||||||||||||||||||
| [发表评论] [本类其他产品] [本类其他供应商] [收藏] | ||||||||||||||||||||||||||||||
| 销售商: 武汉普百康科技发展有限公司 | 查看该公司所有产品 >> |
SleepSign for Animal was developed by Kissei Comtec in Japan and was designed to assist researchers with basic sleep research in laboratory animals. Since its introduction in the market, SleepSign for Animal has been selected as the preferred software for Sleep Analysis studies by an increasing number of researchers all over the world.
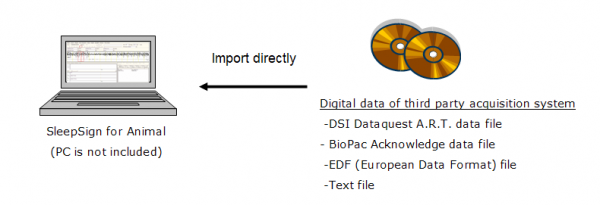
1.Import digital data from third party acquisition system
SleepSign can import following digital data directly;
- DSI Dataquest A.R.T. waveform and parameter data files
- BioPac AcqKnowledge data files
- EDF (European Data Format) files
- Text files
 |
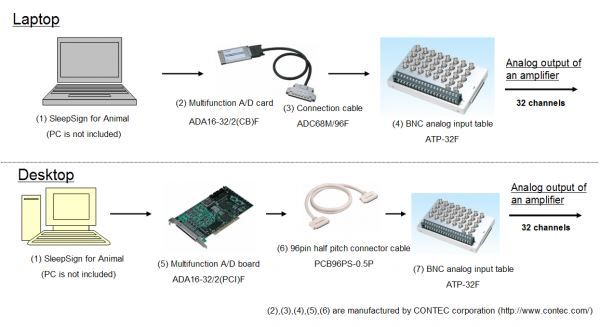
2.Interface with analog amplifier
The SleepSign data acquisition program and related hardware enable you to acquire data from the analog output of your amplifier and store it as digital data in a PC. A PC and an amplifier are not included with this system.
 |
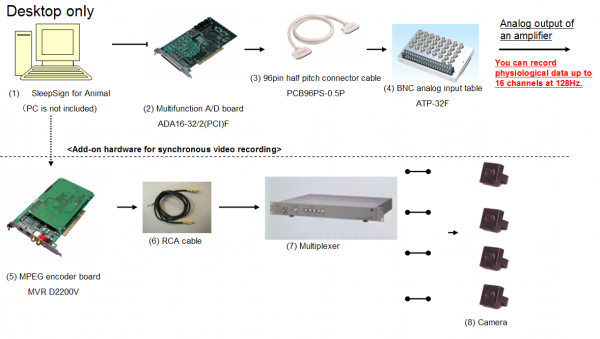
3.Synchronous video recording
You can record video data synchronously with physiological data by installing additional hardware (MPEG encoder board, cameras). You can record up to four video inputs at a time by applying a multiplexer. The MPEG encoder board; MVR D2200V is manufactured by CANOPUS corporation (http://www.canopus.com/Index.asp).
 |
Digital Video
Video Recording
- You can record video information synchronously with physiological data by adding additional hardware (MPEG encoder board, cameras) to SleepSign data acquisition system.
- You can import a digital video file acquired by third party system such as Microsoft Windows Media Encoder.
- You can record up to four video inputs by applying a multiplexer.
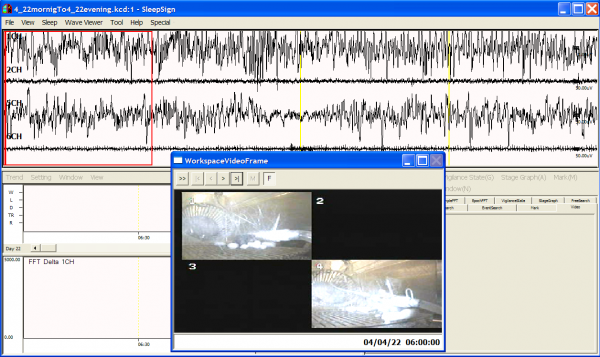
Video Playback
- You can review video data along with EEG, EMG, and other physiological data.
- You can insert event markers while you observe the video. That enables you to highlight and quantify abnormal behaviors of animals
- You can save the SleepSign window image as AVI file. That enables you to create visual aids of your presentation easily.
Sleepsign Analysis Program
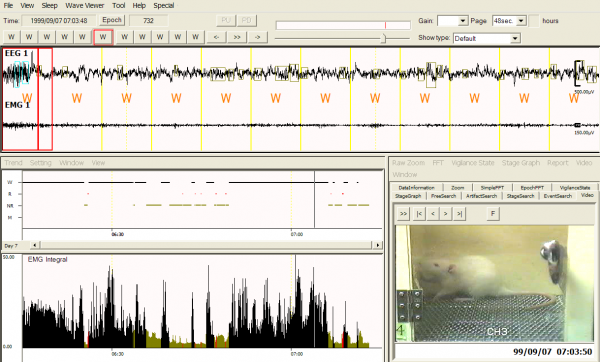
1.Waveform Viewer
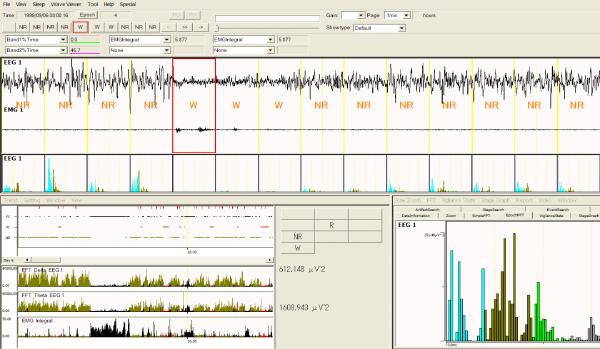 1 min/page display |
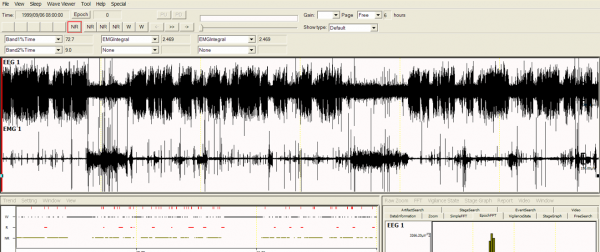 6 hours/page display |
- You can select the page length from 4 seconds to 24 hours.
- Events are displayed on the waveform if events have been inserted by the acquisition program. With the Event Search function, you can jump to an epoch where an event is inserted.
- An FFT spectrum of the currently selected epoch is displayed on the right bottom of the window (Epoch FFT).
2.Stage Scoring
The auto-scoring function and many useful functions to assist your manual scoring and drastically reduce the labor and time you spend on sleep/wake stage scoring.
- Auto-Scoring
SleepSign scores sleep/wake stages automatically based on EEG and EMG. The criteria of the auto-scoring can be configured flexibly to satisfy various criteria of each researcher. Auto-Scoring results can be manually modified very easily.
NEW FUNCTION !! Multi animal staging can be simply performed just with one step presetting. You can drastically reduces the time and labor you spend on stage scoring with its Auto-Scoring function.
Multi Animal Scoring - Manual-Scoring
- You can manually score sleep/wake stages quite easily by using a mouse or a keypad.
- Three or five rows of pages can be displayed, and scored at a time.
- You can display FFT spectrums of each epoch in a page (Page divide FFT). You can refer to these FFT spectrums when you score sleep/wake stages.
- You can list epochs which satisfy criteria of multiple stages of auto-scoring. This function helps you to review and modify the subtle part of auto-scoring results.
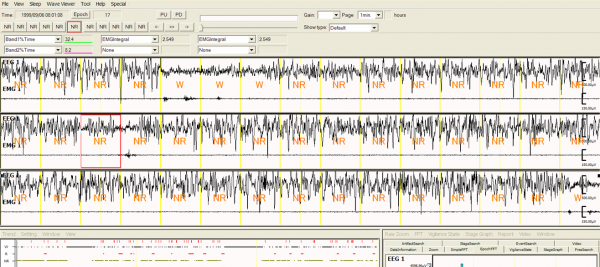
1 min/page three rows display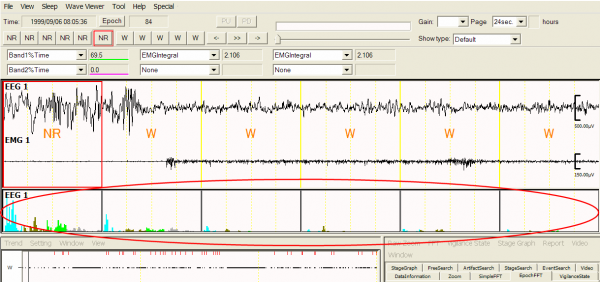
Page divide FFT
The following Epoch length can be selected: 4, 5, 8, 10, 12, 20, 30, 60 seconds. You can select suitable stage classification from pre-assigned stages (Wake, REM, NREM, Light, Deep, etc.) and up to three un-assigned stages. - Artifact Stage
You can mark epochs which contain artifacts as artifact stages automatically or manually. Artifact stages are excluded from the calculation ofaverage FFT, which represents sleep quality, while they are counted for the Stage Graph and the Vigilance State Parameters, which represent sleep quantity. An asterisk is displayed above the stage name if the epoch is indicated as an artifact stage.
3.Hypnogram/Trend Graph
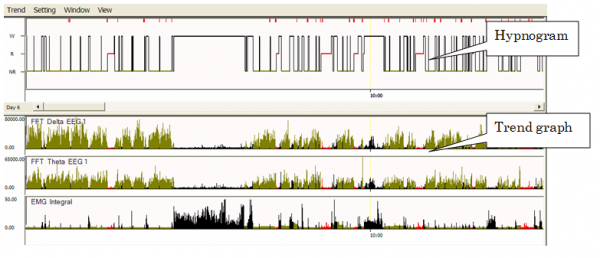 The stage scoring result is displayed as the Hypnogram. In addition to the Hypnogram, various sorts of information can be displayed as Trend Graphs on the same time scale. The sorts of Trend Graphs are as follows; The stage scoring result is displayed as the Hypnogram. In addition to the Hypnogram, various sorts of information can be displayed as Trend Graphs on the same time scale. The sorts of Trend Graphs are as follows; |
*if you import data files from the DSI Dataquest A.R.T system, you can display parameters saved in the parameter file (such as activity, temperature, heart rate) as Trend Graphs. You can print the Hypnogram and Trend Graphs as well as save it as a text file or a bitmap file. |
4.Stage Graph
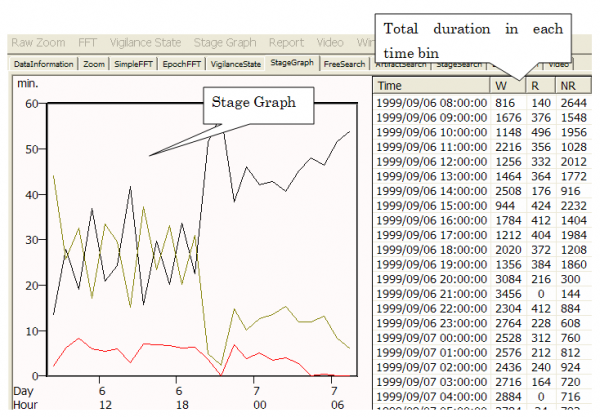 |
SleepSign calculates the total duration or percentage of each sleep/wake stage by any time bin and time range, and draws the Stage Graph. You can print the Stage graph as well as save it as a text file or a bitmap file. |
5.Vigilance State Parameters
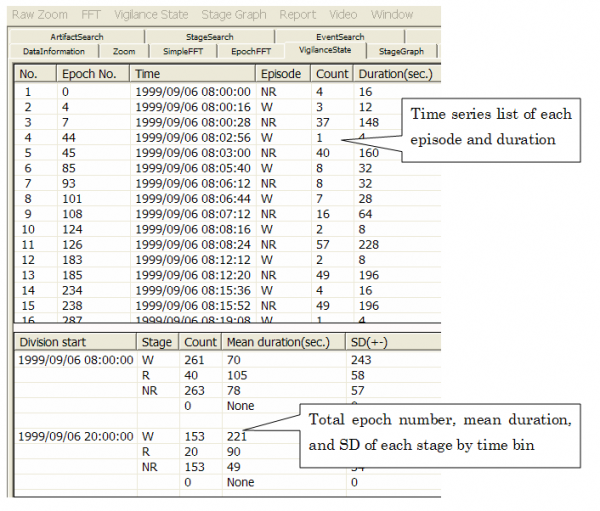 |
SleepSign displays a time series list of each episode (a series of sleep/wake stages) along with duration of each episode. In addition, frequency, mean duration, and standard deviation of each episode are displayed. You can calculate and display Vigilance State Parameters by any time bin and time range (ex: light period vs. dark period, or every 6 hours). With this function, you can grasp the transition of sleep/wake patterns easily. |
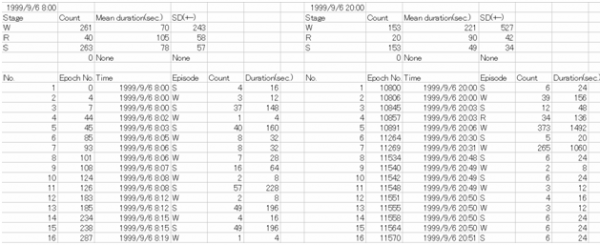 |
You can save the Vigilance State parameters result in a text file. |
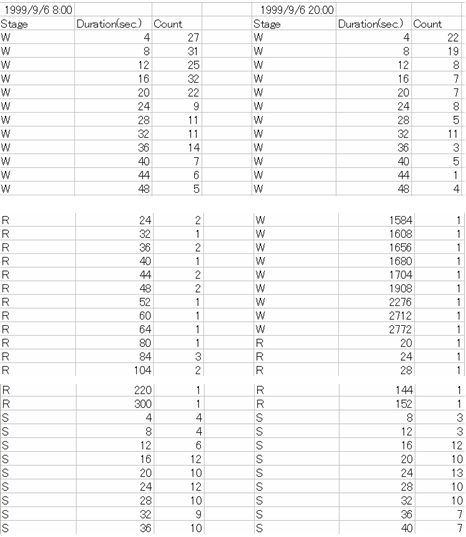 |
You can also obtain the frequency of each episode sorted by duration |
6.Average FFT
SleepSign calculates average FFT spectrums of each sleep/wake stage by each time bin and time range. The result can be saved as a text file. The average FFT spectrum is referred to as an index of sleep quality by comparing them by units or different periods of time (ex: light period vs. dark period, sleep deprived vs. control).
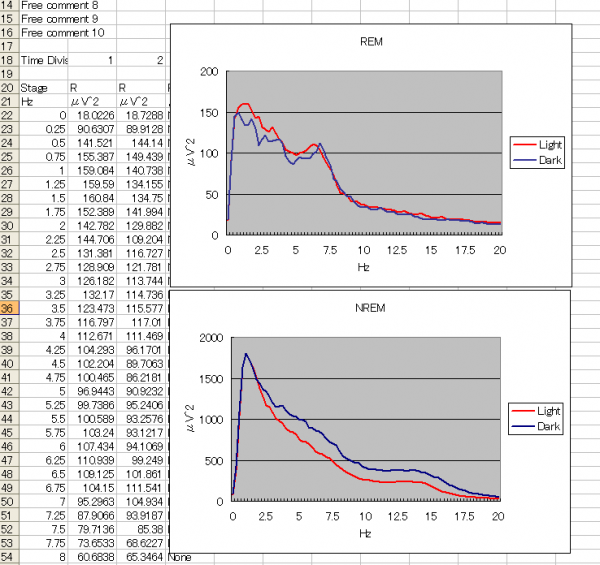 |
Average FFT of NREM and REM in light period and dark period |
7.Other functions
- Digital filter
You can apply low path filter, high path filter, band path filter, band stop filter, or smoothing to each channel. - Save as a bitmap file
You can save the following images as a bitmap file: Whole window, waveform, Hypnogram/Trend Graph, Stage Graph, etc. - Print
You can print the following images: waveform, Hypnogram/Trend Graph, Stage Graph - Save as a text file
You can save the following values as a text file: raw data, Hypnogram/Trend Graph, FFT result, Vigilance State Parameters, Stage Graph, etc.
- You can print auto-scoring parameters or save them as a text file.